Simplify trading through visualizing and quantifying the rate of change of the order book
Changes in the order book near a security’s current price level are incredibly impactful on price action yet go completely unnoticed by many traders. The Pulling & Stacking Indicator can signal order flow changes close to the spot price seconds to minutes before price movement is realized. This indicator provides time series view of order pulling and stacking across a customizable order book depth to help you avoid missing signals before action happens. This indicator is designed for traders seeking to better time their order entries and exits or increase the profit percentage of their trades.
When we set out to build the Pulling & Stacking Indicator, we also set out to understand what types of tools successful traders use. Through performing user research, we observed that tooling was quickly rejected by successful traders if the tool created unnecessary noise, perceived noise, or distractions. Therefore, in every design iteration of the indicator that we make, our focus is to ruthlessly improve clarity and quantifiability of order flow while reducing complexity of use and configuration. User research with successful traders also revealed that they avoid tools that dress up the truth or overcomplicate technical analysis.
Watch this overview video of the Pulling & Stacking Indicator's basic functions and the underlying theory which it's designed upon.
|
The result is the creation of a surprisingly simple tool that presents an important signal that was difficult to access before now. The Pulling & Stacking indicator visualizes and quantifies the rate of change of the order book over time. Whether you're a trader that already uses order flow analysis or a trader that is seeking to refine their trading methodology, the Pulling & Stacking Indicator may be the tool that simplifies your trading decisions.
Bookmap is a powerful platform that provides a visualization of the order book. With the Pulling & Stacking Indicator add-on for Bookmap, the visualization of the order book is enhanced by a visual representation of the rate of change of the order book. The Pulling & Stacking Indicator analyzes the order book at up to 20 times per second, giving traders a real-time view of the rate of change in the order book.
The Pulling & Stacking Indicator is available for download and purchase in the Bookmap Marketplace.
Pulling means orders are being removed from the order book
Stacking means orders are being added to the order book
There are four key order flow events that we are looking for:
1) Stacking of buy orders, which is a bullish signal
2) Pulling of buy orders, which is a bearish signal
3) Stacking of sell orders, which is a bearish signal
4) Pulling of sell orders, which is a bullish signal
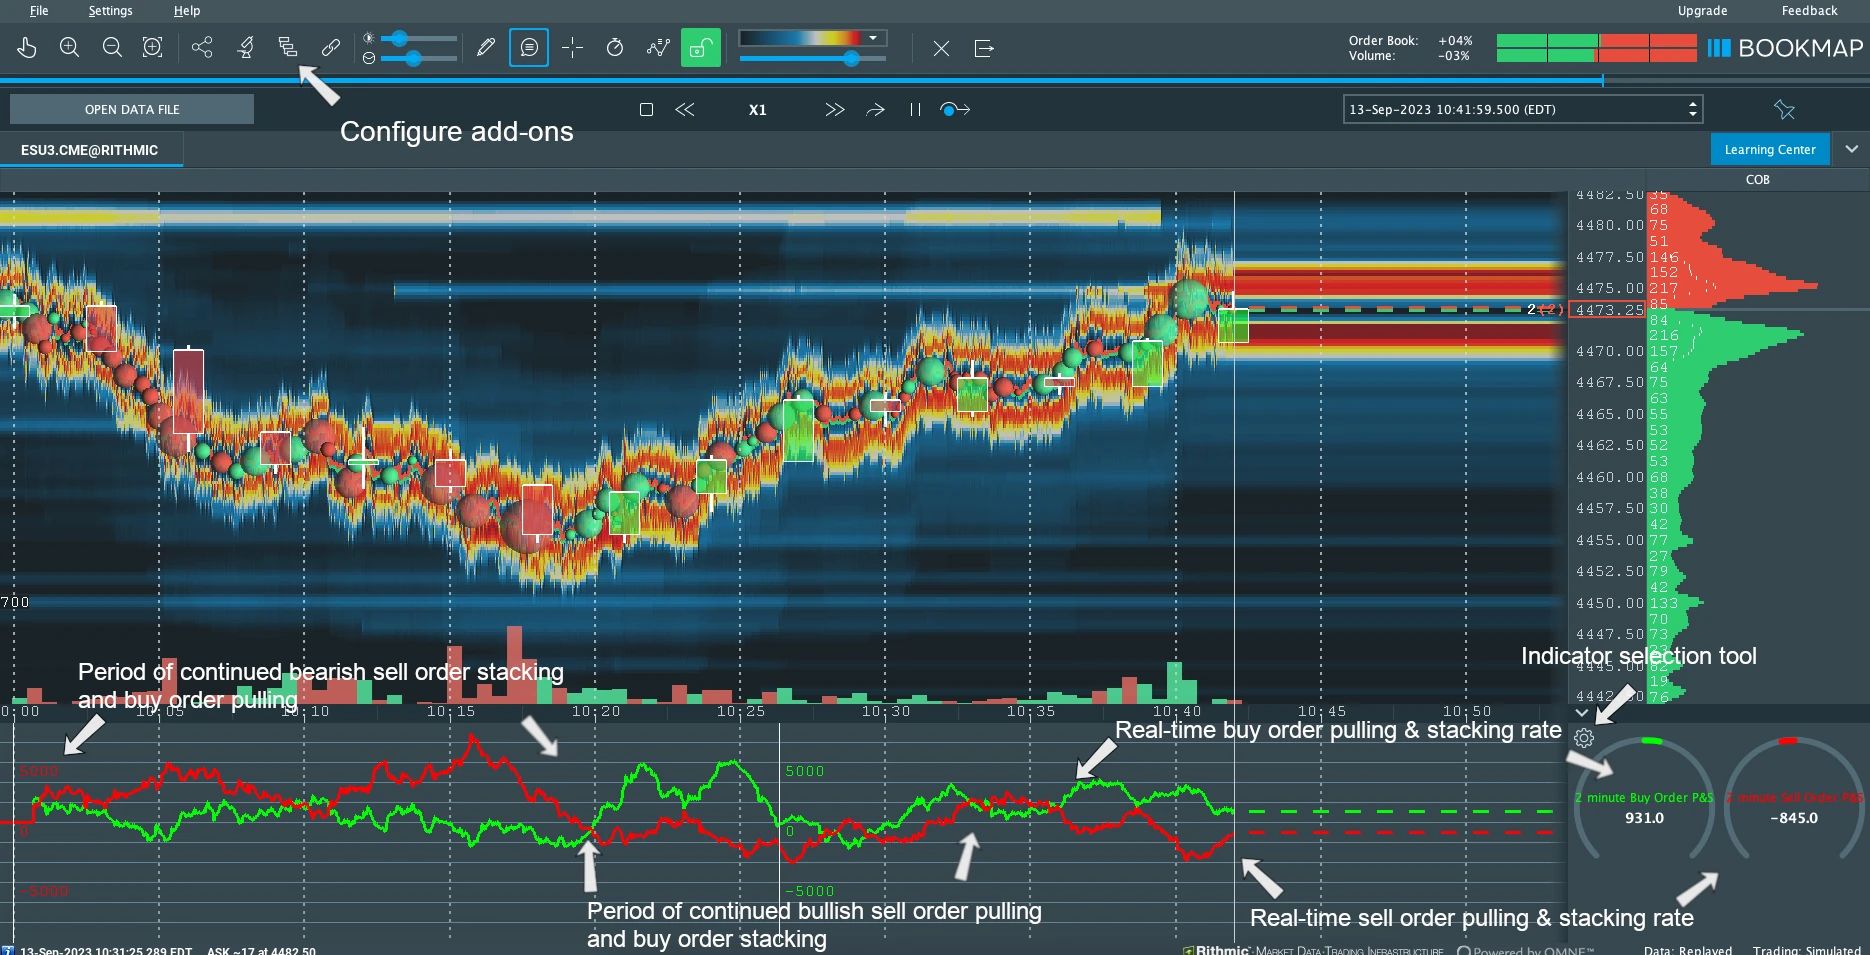
Below is the Pulling & Stacking Indicator operating in the main Bookmap screen for ES Mini on the Rithmic data feed.
In the example above, the buy order and sell order indicator lines are show the total number of buy and sell orders that have been added or removed for ES Mini over the past two minutes within +/- 10 levels (a level is $0.25 for ES Mini) of the spot price. Positive values indicate stacking while negative values indicate pulling.
During periods of "sideways" price movement, the buy order and sell order lines tend to oscillate rather evenly. Therefore, pay attention to sharp and quick changes in pulling and stacking activity as that may be a precursor to price movement. For example, if pulling and stacking activity was ranging between 500 and 4000 for most of the trading session, seeing pulling activity suddenly reach -3000 for one indicator line while stacking activity reaches 8000 for the other indicator line could be a significant order flow event which may be paired with significant price action. Read more about how to interpret pulling and stacking activity using a methodology called Volume, Price, and Order Flow analysis.
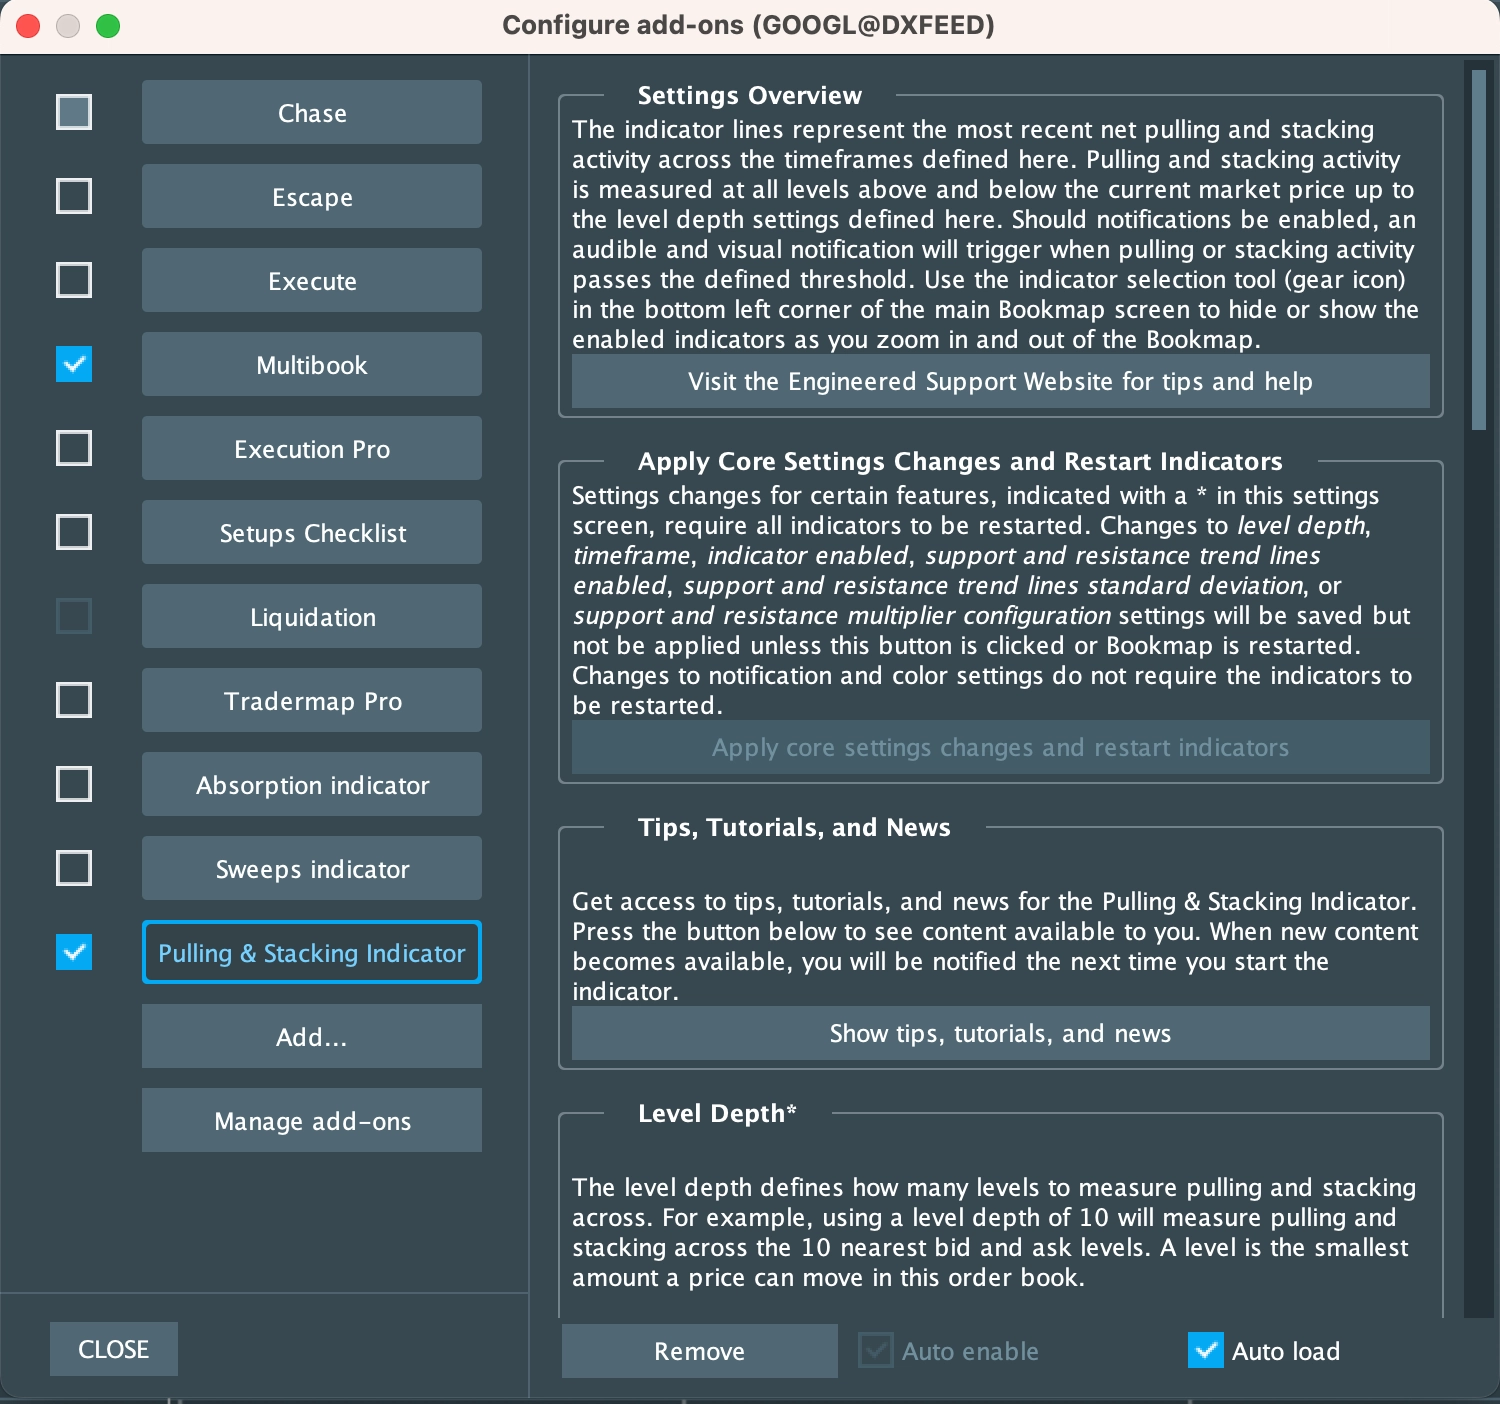
The time frame and other settings can be configured by selecting the Configure add-ons button, then selecting Pulling and Stacking Indicator.
Below is the settings screen for the Pulling & Stacking Indicator which is available by selecting the Configure add-ons button, then selecting Pulling and Stacking Indicator.
Apply Core Settings Changes and Restart Indicators: changing certain settings (level depth, indicator enabled, or timeframe) requires the indicators to be restarted. Making changes to those settings without clicking this button will not enable the settings changes unless Bookmap is restarted.
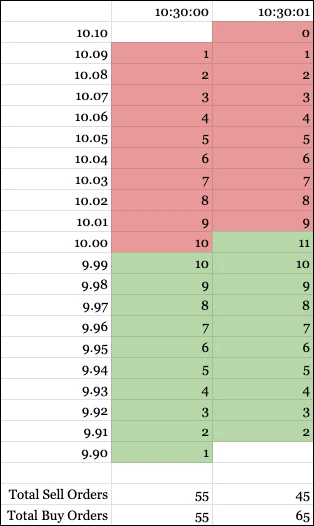
Level Depth: this number defines how many levels above (for the sell order line) and below (for the buy order line) to monitor. Pulling and stacking is measured by comparing the buy and sell orders in the order book for a security across multiple frames. Consider the example below which represents a part of the order book (10 levels above and below the spot price) for a fictitious stock at two different times. Within those levels, there are 10 buy orders stacked and 10 sell orders pulled a second after 10:30:00 AM. This gives us two bullish signals.
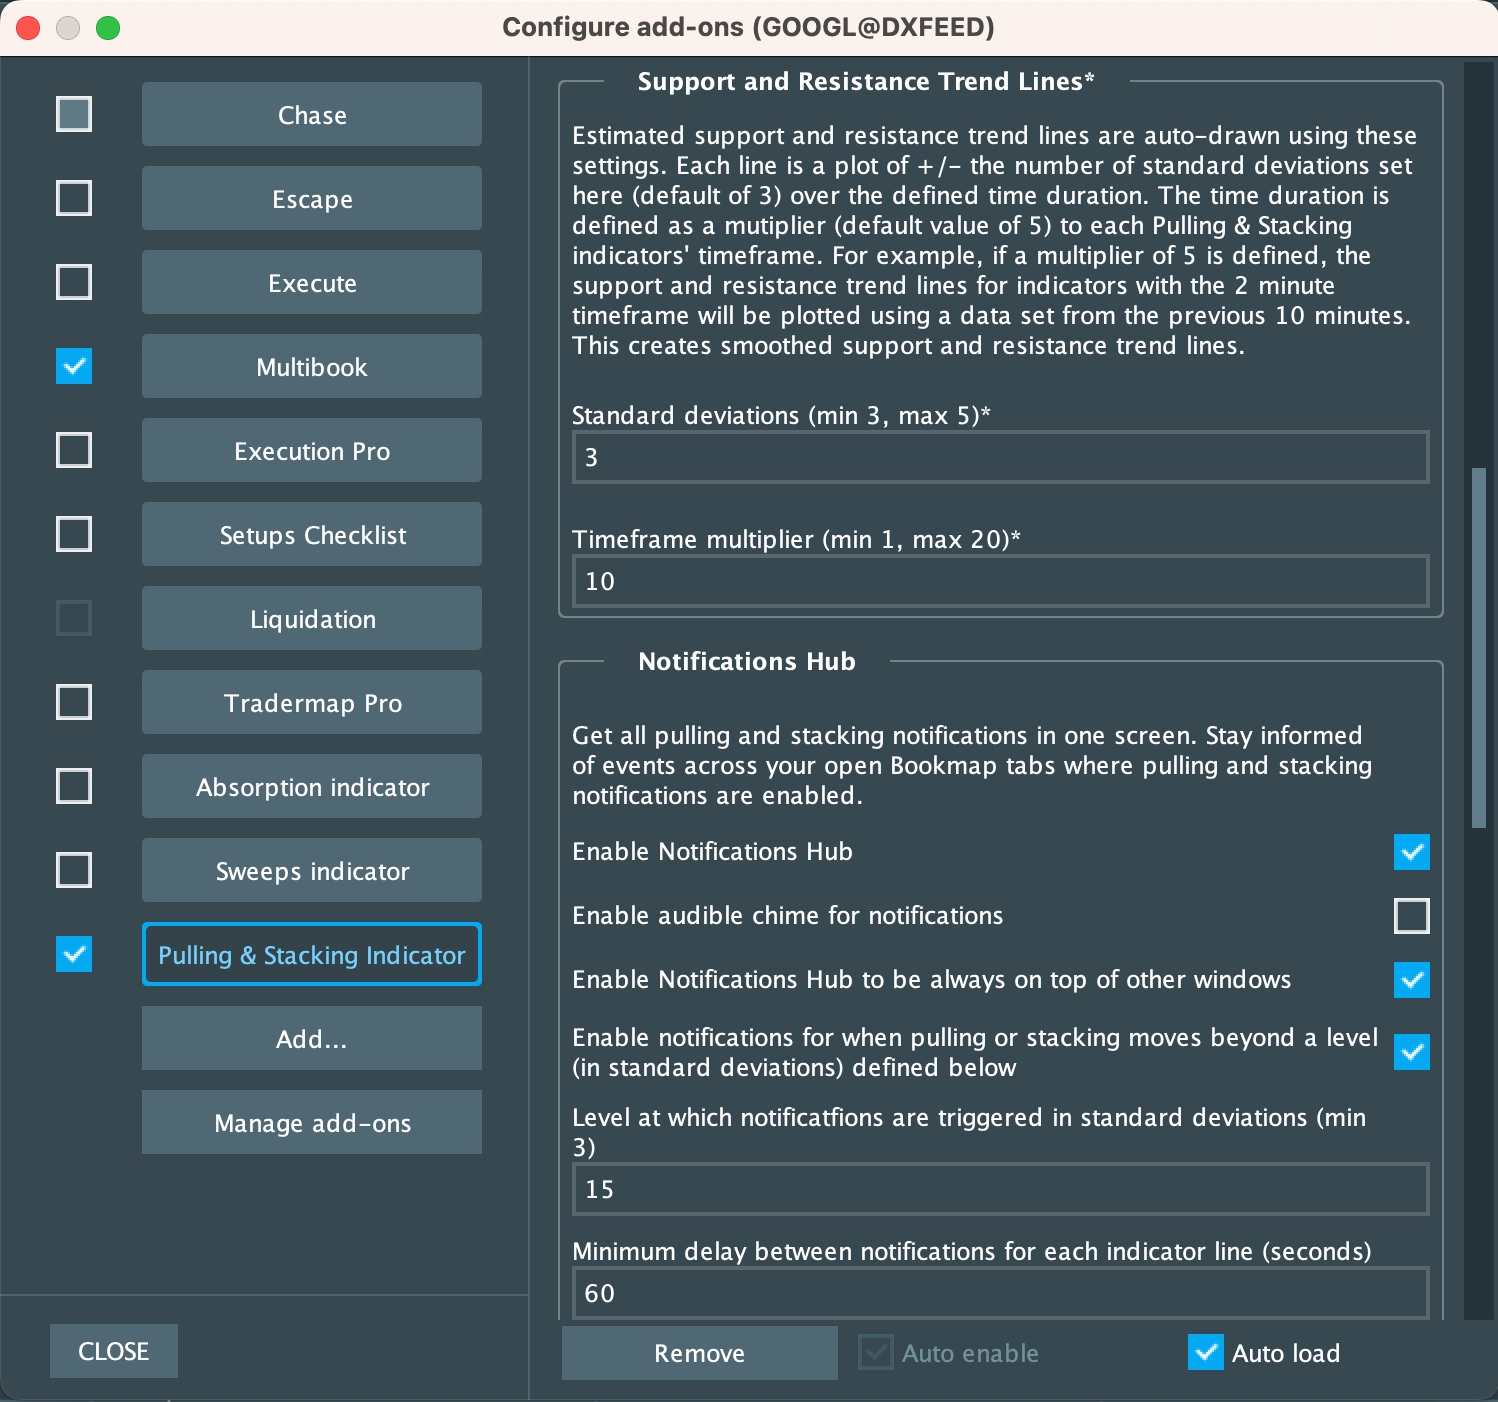
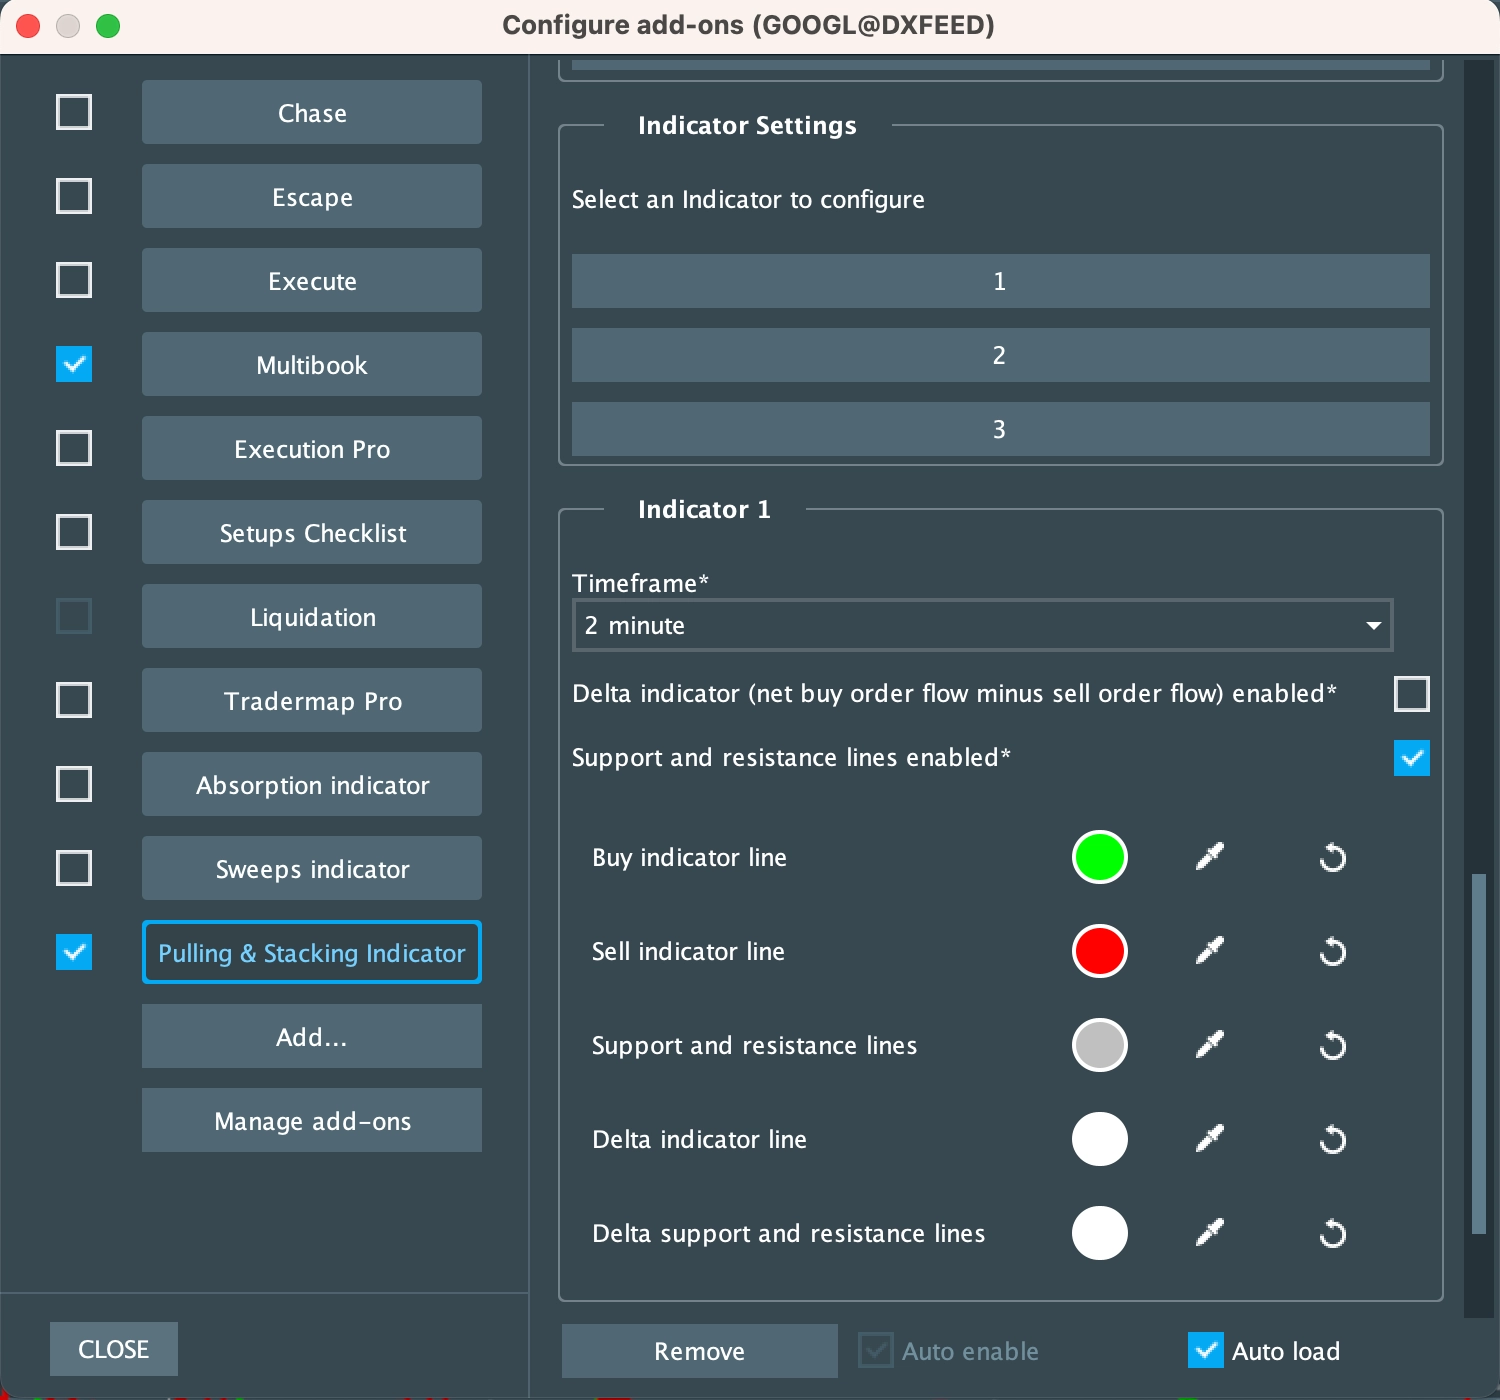
Support and Resistance Trend Lines: The support and resistance lines can be used to help guide as to what are significant levels of pulling and stacking. The support and resistance sensitivity is configured using two values; its standard deviation and a timeframe multiplier. For example, the indicator shown in this page is configured with a timeframe of 2, a standard deviation of 3 and a timeframe multiplier of 10. With this configuration, the Pulling & Stacking indicator is estimating that about 99% of the buy and sell line’s data points are between the support and resistance lines based on the last 10 minutes of order flow data. If the buy or sell lines significantly cross these support or resistance lines, that is an indication that a significant order flow event may be occurring. Changing the configuration for the support and resistance lines allows for the fine-tuning of the sensitivity of the Pulling & Stacking indicator’s signals.
Notifications Hub: The Pulling & Stacking indicator generates notifications by comparing current pulling and stacking activity to previous activity. Notifications are triggered when pulling and stacking activity moves beyond a configurable notification level. The notification level’s unit of measure is some number of standard deviations. The data set used to calculate the standard deviation is the most recent indicator data across a configurable period. That configurable period is defined by multiplying the timeframe multiplier, which can be found in the support and resistance section of the settings screen, by the indicator’s timeframe.
Multiple Indicator Lines: one indicator is always enabled and up to two more can be enabled by selecting the Indicator Enabled checkbox.
Timeframe: the indicator timeframes work similar to price candles in the sense that order flow is measured over a rolling period that can be specified. Longer timeframes give larger context to order flow, while shorter timeframes are more sensitive to small changes in order flow. Indicators with short timeframes may not be easy to read when zoomed out in the Bookmap while indicators with a longer timeframe may provide less of a leading indicator for price action. When trading using the Pulling and Stacking Indicator for the first time for a specific security, spend time researching which timeframes give the best signals for the security and your trading style. Multiple indicator lines may be configured in the Configure add-ons screen, making it possible to switch between indicator lines with different timeframes. Indicators can be toggled on and off via the Indicator Selection Tool.
Delta Line: the delta line shows a line representing net pulling and stacking. It is calculated by subtracting the sell order pulling and stacking from the buy order pulling and stacking. Support and resistance lines are available for the delta line as well.
Buy order and sell order colors: select a custom color for each indicator line.
Pricing
Monthly Subscription: $27/month
Yearly Subscription: $243/year
For questions, comments, and feedback, please email contact@engineeredanalytics.com.
The Pulling & Stacking indicator is a tool for interpreting market activity, not as a tool that provides guarantees or certainties for future market activity. Order flow and other market patterns for a security may change at any moment regardless of prior indicators. Trading securities may lead to financial loss. Exercise caution when trading securities. No warranties or guarantees are provided.