Order flow close to the spot price is a leading indicator for price movementImagine there is a fire burning which has a few wooden logs as fuel. If no logs are added to the fire, the fire will die down. If a few more wooden logs are placed near the fire, we may predict the fire will grow. If a tonne of wood logs are placed near the fire, we may predict the fire will grow quickly and intensely. The same is true for order flow. Order flow is the process of buyers and sellers placing orders at a specified price. Consider an example where there is a large number of buy orders placed close to the spot price of a security. We may interpret that as a bullish signal as there is a significant probability of those orders being filled which, in turn, may lead to increased volume and price movement. Large numbers of sell orders placed close to the spot price of a security may similarly be interpreted as a bearish signal. Monitoring the change in order quantities across price levels close to the spot price gives us these important signals. 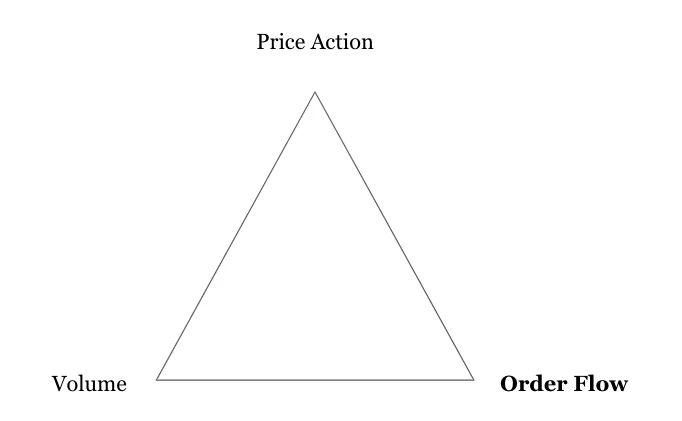 Engineered adds order flow analysis to an established technical analysis method called Volume Price Analysis to form a more cohesive methodology. We call this Volume, Price, and Order Flow Analysis. In this technical analysis method, we are looking to see if Volume, Price, and Order Flow are giving signals that are in agreement or disagreement. If they are in agreement, we have strong signals. If they are in disagreement, we have weak signals or no signals. Order flow is measured by looking into the order book and quantifying pulling and stacking of orders within a narrow distance from the spot price.
Pulling means orders are being removed from the order book
Stacking means orders are being added to the order book There are four key order flow events that we are looking for: Pulling and stacking is measured by comparing the buy and sell orders in the order book for a security across multiple frames. Consider the example below which represents a part of the order book (10 levels above and below the spot price) for a fictitious stock at two different times. Within those levels, there are 10 buy orders stacked and 10 sell orders pulled a second after 10:30:00 AM. This gives us two bullish signals. 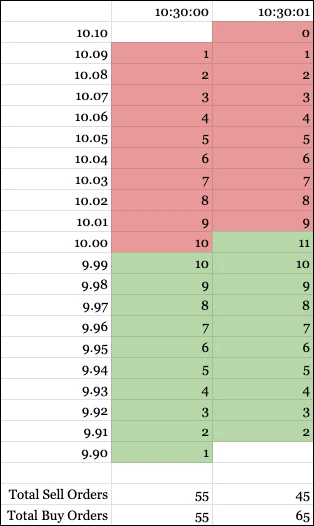 Establishing two more definitions will help us use Volume, Price, and Order Flow analysis.
Volume is the number of shares or contracts traded in a security or an entire market during a given period of time. It is simply the amount of buying and selling of a security and is measured in shares or contracts.
Price action is the movement of price over time which is described as bullish (increasing price), bearish (decreasing price), or flat (no or little change in price). When we can visualize pulling & stacking, price action, and volume in a single pane in a quick and easy way, detecting strong signals for market events becomes possible. The Pulling & Stacking Indicator by Engineered processes complex live data streams to visualize these important order flow signals in real time with ease. Here are examples of how to analyze Volume, Price, and Order Flow using the Pulling & Stacking Indicator. This is available for download in the Bookmap Marketplace. Example 1: Significant Price Action, Significant Volume, Significant Bullish Order Flow 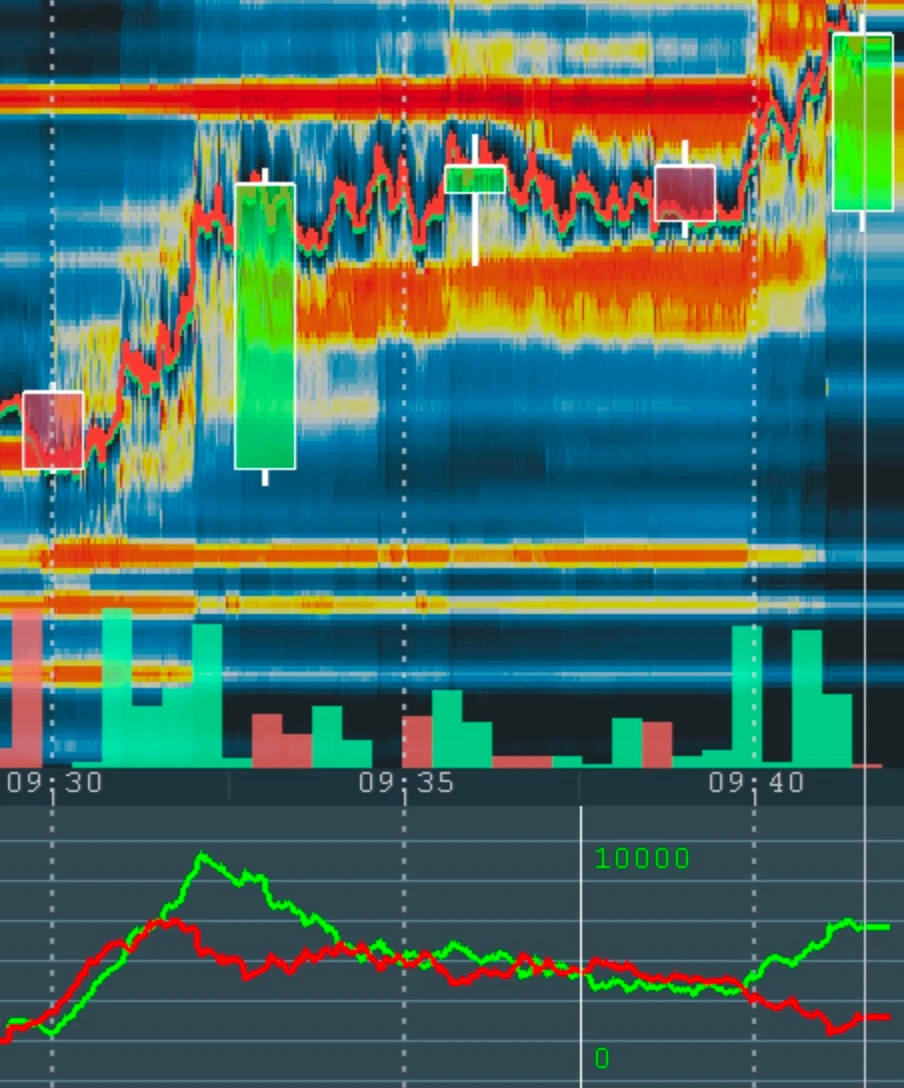
Bullish price action is represented by the large green candles. Bullish volume is represented by the green (bullish) vertical bars exceeding the red (bearish) vertical bars. Buy order flow is represented by the green line graph which stacks significantly compared to the sell order flow which is represented by the red line graph. This results in three agreeing bullish signals. Example 2: Significant Price Action, Significant Volume, Significant Bearish Order Flow 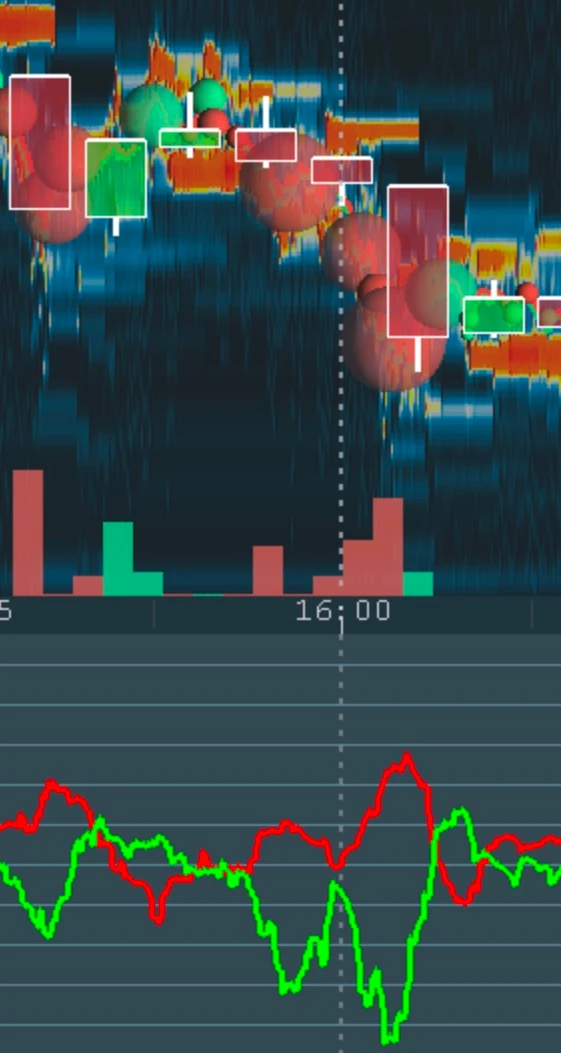
Bearish price action is represented by the large red candles. Bearish volume is represented by the red (bearish) vertical bars exceeding the green (bullish) vertical bars. Buy order flow is represented by the green line graph which pulls significantly compared to the sell order flow which is represented by stacking in the red line graph. This results in four agreeing bearish signals. The Pulling & Stacking Indicator is available for download and purchase in the Bookmap marketplace.
We present Volume, Price, and Order Flow analysis as a method of interpreting market activity, not as a model that provides guarantees or certainties for future market activity. Order flow and other market patterns for a security may change at any moment regardless of prior indicators. Trading securities may lead to financial loss. Exercise caution when trading securities. No warranties or guarantees are provided. |
|